![[ freespace ]](http://wpigniter.wpenginepowered.com/files/2014/03/freespace-header.jpg)
Networking [ freespace ] PART 2
General NewsWith another month paid for, can we consider [fs] a success? I would like to argue yes, especially if [fs] has connected people and groups that otherwise would have never met. But how can we show that this is the case? The answer may be in the numbers.
Two weeks ago, I posted a blog entry asking [fs]ers to fill in a spreadsheet with information about their personal networks*. Specifically, a list of their organizational affiliations. I then used this information to run “social network analysis” [SNA] on both the network of people who responded (40) as well as the network of organizations that are represented by these respondents (109). SNA allows us to map the relationships and flows within a network, giving us both a graphical and mathematical understanding of its inner workings.
To evaluate the importance of [fs] in bridging organizations together, we can look at the location and groupings of ‘nodes’ (in this case organizations) to better understand which are the connectors, bridges, or core actors of the network. In SNA we call this measuring the ‘centrality.’ Below, we’ll look at three of the most popular individual measures of centrality: Degree, Betweenness, and Closeness.
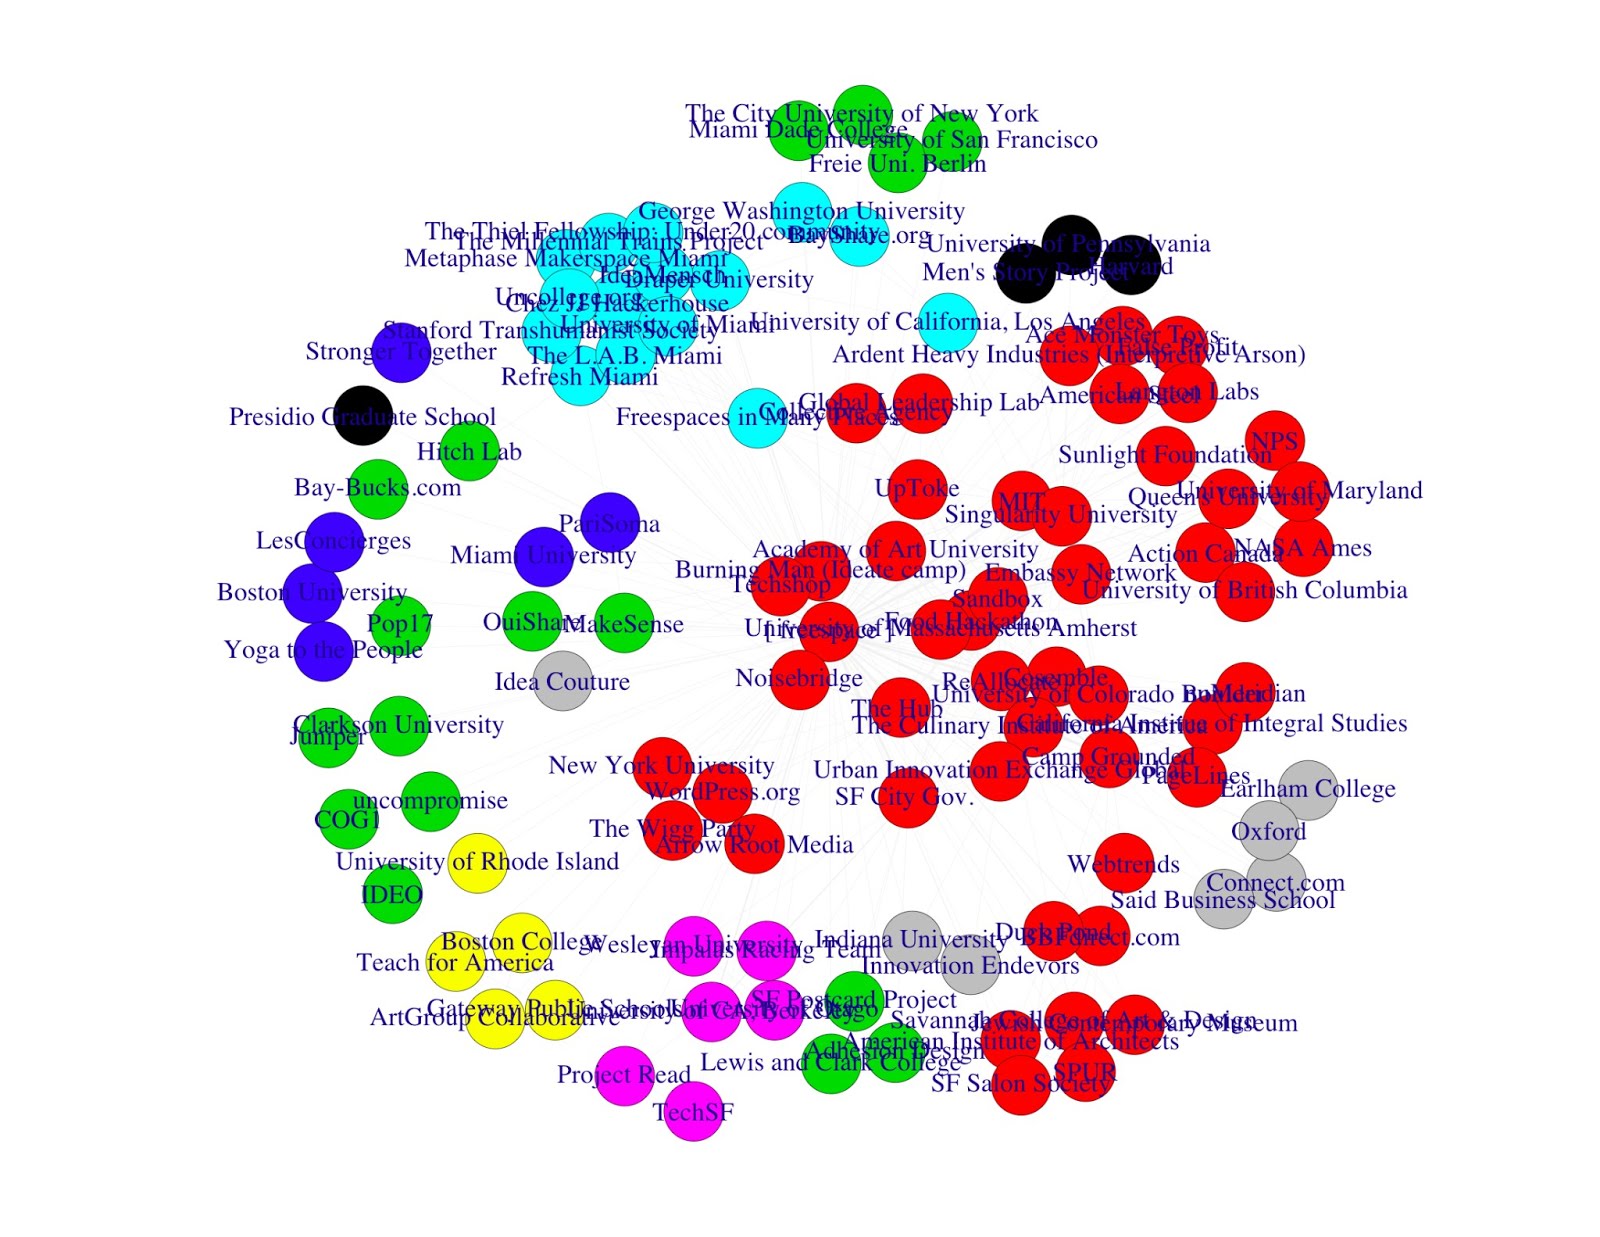
Here is what the organizational network of the [fs] community looks like. In this case, colors represent local communities pulled out by the analysis.
Degree Centrality
SNA measures network activity by evaluating the number of direct connections for each node. Nodes with more direct connections have higher degree centrality and are the ‘connectors’ or ‘hubs’ in a network. In our case, by default, [fs] comes in with the highest possible degree measure of 1 (values go between 0 and 1) since ALL of the people on the spreadsheet belong to [fs]. Next is ReAllocate with 0.24, and then Camp Grounded and Singularity University tying with 0.21. Unfortunately, proving [fs] connects us together isn’t as simple as showing we all took part. What really matters is how [fs] connects the otherwise unconnected! It could be the case that [fs] only connects those who are already connected together.
Betweenness Centrality
So enters ‘betweenness,’ a measure that allows us to see if the location of a node in a network brokers connections between disparate groups. A node with a high betweenness measure (again between 0 and 1) plays an extremely important role in a network, allowing information to flow between different clusters. In our case, [fs] again comes in on top with a score of 0.73. Next in place we have SF City Government with 0.26 and Freespace in Many Places (an organization built off the back of FS!) with 0.25. With such a high betweenness measure, the numbers definitely suggest [fs] is working as a connector.
Closeness Centrality
Lastly, we look at a measure of the shortest paths to all nodes in a network – closeness. A node with high closeness (values between 0 and 1) has the best visibility into what is happening in a network. In trying to make the argument that [fs] is bringing people together, closeness may be one of the most important measures, since a high value would suggest [fs] not only bridges groups but also allow us to transfer knowledge more easily between them. In our SNA, [fs] again has the top score, but this time, closeness scores are so low that it’s likely the network is too dispersed for information to flow efficiently in the first place. The top closeness values were [fs] with 0.007, Cosemble and The Culinary Institute of America tied with 0.005, and Ace Monster Toys with 0.004.
So, all in all, does SNA confirm that [fs] is a connector? The answer seems to be yes, but there are some caveats. For example, many of the organizations added to the spreadsheet had only 1 member and were therefore only connected via [fs]. What happens if we analyze only the organizations that were previously connected? (In this case the 20 organizations that had at least 2 members). Does that change the analysis? Here is the new network diagram:
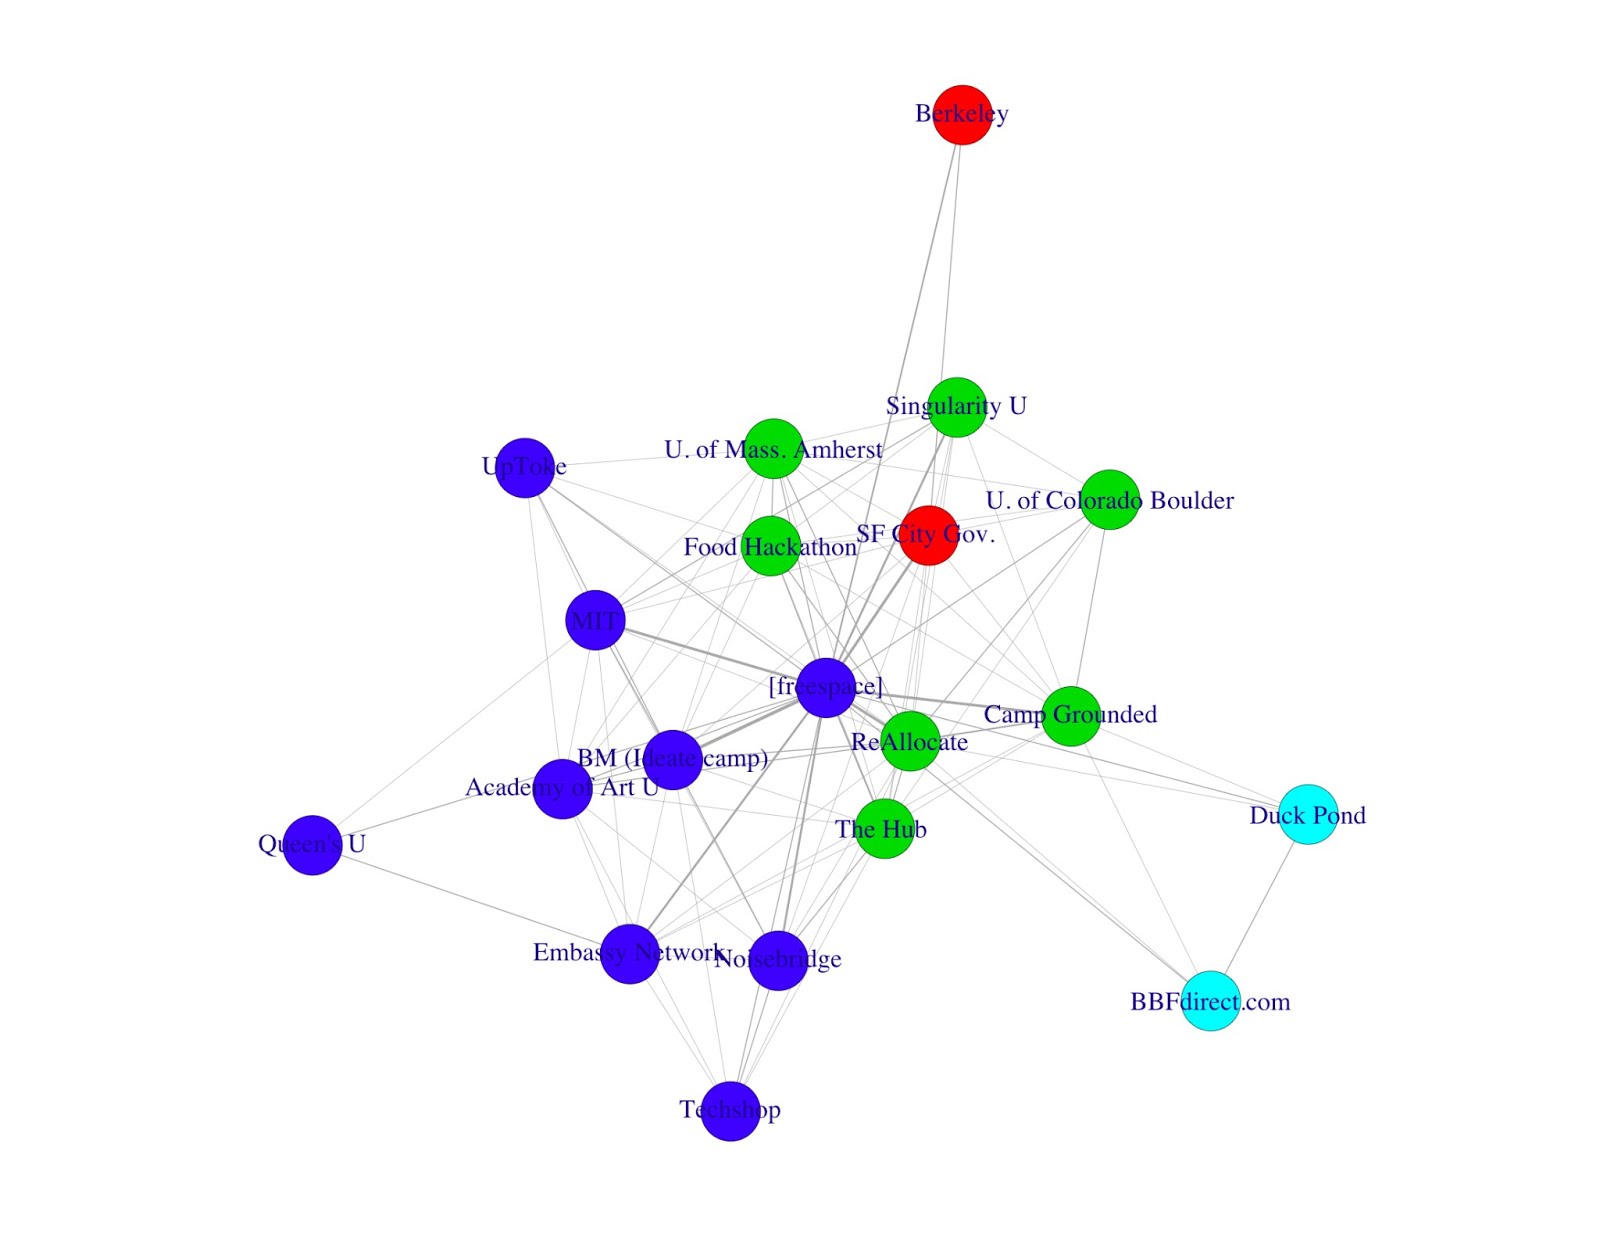
As you can see, things look very different. [fs] is still in the center with a degree centrality of 1, since all of the respondents are members, but the structure is much less distributed. Now ReAllocate and The Hub also have high degree values (0.89 and 0.68 respectively). Because the network is more linked, [fs] no longer acts as a bridge. [fs]’s betweenness measure for this network clocks in at 0 with SF City Gov., ReAllocate, and MIT acting as the main hubs (0.15, 0.13, and 0.11). Closeness measures in this smaller network are larger, but again [fs] is not the main actor (0.021). Here, SF City Gov. wins out, with Food Hackathon and U. of Mass. Amherst tying for second (0.034, 0.033, and 0.033).
In summary, it seems [fs] IS connecting us together, but in a very specific way. What [fs] seems to be doing is acting as a bridge between the outliers in our networks – the companies, nonprofits, and groups to which only a few of us belong. What [fs] is not doing is helping connect those organizations in which many [fs]ers already take part. Interestingly, this fact may be one of the best success measures we could have hoped for. By connecting the periphery [fs] should (over time) pull those outlying organizations into the main group, where it can be sustained once [fs] moves on.
* In itself, creating the spreadsheet was a bit of an experiment in crowd-sourcing, and I am the first to admit that the results should be taken with a grain of salt. Feel free to check out the R code I used over here. It includes a few more bells and whistles I played with, but didn’t blog.

No comments yet.